⏱️ Sectional Time Ratings & Analysis
What are Sectional Time Ratings?
Sectional Time Ratings are a clear, numerical way to measure the speed a horse has shown in different parts of a race, as well as across the entire race distance. These ratings are expressed in lengths, comparing the horse’s speed to TopRate’s performance benchmark standard.
- A positive figure (e.g. +5.2) means the horse went 5.2 lengths faster than the standard.
- A negative figure (e.g. –3.5) means the horse went 3.5 lengths slower than the standard.
The Range of Sectional Ratings in TopRate
TopRate delivers a suite of sectional ratings that allow you to analyse races at varying levels of detail.
DETAILED BREAKDOWN
- I-E = Individual Early Speed to the 800m mark (or 600m when 800m data is not available.)
- I 8-6 = Individual speed from the 800m to 600m
- I 6-4 = Individual speed from the 600m to 400m
- I 4-2 = Individual speed from the 400m to 200m
- I L2 = Individual speed from the 200m to finish
- I Time = Individual overall time rating (entire race distance.)
The sum of the individual sections (I-E through to I L2) will equal the I Time rating (give or take 0.1 for rounding.)
SUMMARY MEASURES
- I T6 = Individual speed to the 600m.
- I L6 = Individual speed for the last 600m.
- I T8 = Individual speed to the 800m.
- I 8-4 = Individual speed from the 800m to 400m.
- I L4 = Individual speed for the last 400m.
- I L8 = Individual speed for the last 800m (the sum of I 8-4 and I L4)
TopRate Example: 23/8/25 - Randwick Race 7 - G3 Toy Show Quality

Autumn Glow’s win provides a good illustration of how sectional ratings work in practice. She recorded an Overall Time Rating (I Time) of +7.2 lengths faster than standard.
That performance was built in two parts:
- To the 600m mark: +1.2 lengths faster than standard
- Last 600m: +6.0 lengths faster than standard
Breaking the final 600m down further shows how her acceleration built section by section:
- I 6–4: +1.3 lengths
- I 4–2: +2.2 lengths
- I L2 (final 200m): +2.5 lengths
This breakdown highlights not only her overall speed but also her ability to sustain and increase speed through each stage of the final sprint.
How are the Sectional Time Ratings calculated?
TopRate’s sectional time ratings are the product of a rigorous meeting review process, designed to ensure accuracy and consistency. Unlike systems that rely solely on automation, every meeting is carefully reviewed and refined to account for the nuances that automated outputs often miss.
We begin with the raw data of verified race times and individual runner sectional times. These are loaded into our review template alongside key reference data such as:
- Overall and sectional par times for the track and distance
- Expected race ratings based on the horses engaged and their past performances
From there, raw figures are compared against expectations to determine how fast or slow conditions were relative to standard. Proprietary techniques are then applied to adjust for the various factors that can influence times on the day, such as particularly fast or slow early race pace, starting position on the track (e.g. chute vs others), wind, and rainfall. Once refined, the adjusted figures are benchmarked against the performance standards for that specific track and distance to generate the final ratings.
⏱️ The Performance Benchmark Standard
Even after adjusting for conditions on the day, times and sectionals can’t simply be rated against track & distance averages. The quality of horses competing at each venue varies too much. A run three lengths quicker than standard at Randwick is not the same as three lengths quicker at Gosford.
That’s why we’ve built Performance Benchmark Standards using time data in combination with our trusted WFA Performance Ratings. These benchmarks account for the quality of horses that have shaped the history of times at each track and distance.
The result? A truly uniform standard. A +6L faster last 600m at Rosehill can now be compared directly to a +6L faster run at Kembla Grange. This makes sectional figures far more practical, reliable, and powerful in your form study.
⚖️ Weight & Luck in Running
It’s essential to understand the context of sectional time ratings. These figures do not account for the weight a horse carried in the race or for factors such as bad luck in running (e.g. covering extra ground wide or being held up in the home straight).
Sectional ratings purely reflect the speed the horse produced in each section, based on the weight it carried and the run it had. Any interpretation of the figures should keep this in mind.
🚨 Why Expert Review Matters
TopRate's sectional ratings are never left to programmed automation. Every meeting is subject to expert review to identify anomalies that computers routinely miss. For example, factors such as misplaced sectional markers, sudden weather changes affecting different distances, or shifting track conditions throughout the day.
Ultimately, sectional time ratings are not an exact science. Don't be misled into believing otherwise. They require a balance of data-driven precision and informed judgement. By applying this balance, TopRate produces a set of figures you can trust. Ratings that are as accurate as possible, reflecting the performance of each horse under the conditions in which they raced.
You can use Sectional Time Ratings in both pre-race analysis (within each horse’s form history) and post-meeting reviews once the results and our final ratings are updated.
Pre-Race Form Analysis
TopRate Form History Example

There are no fixed rules or “magic formulas” for using sectional ratings. Our recommendation is to interpret them in conjunction with WFA Performance Ratings, utilising sectionals to provide valuable context about how a horse achieved its rating and race result, as well as what that might imply for its future performance under different conditions.
⚡ Dynamic Horse Form History
The Horse Form History page in TopRate is fully interactive. You can click any column to instantly sort a horse’s past runs by that variable, including sectional times. This provides a powerful way to spot performance patterns.
Whether you sort the form or review runs one by one, analysing sectional time ratings adds sharper context to a horse’s history and can reveal insights such as:
- Early speed: How a horse’s WFA Performance Ratings vary when forced to travel quickly versus when allowed to relax into a slower tempo. How does the expected early speed and pressure of this race compare to what a horse has faced in the past?
- Peak sprint: Sort by last 800m or 600m times to identify a horse’s top sectional speed and the circumstances that produced it.
- Sectional limits: Understand when a below-par performance may be explained by pace and positioning, which means the sectionals required to win were beyond the horse's peak ability.
- Sustained vs short bursts: Identify which horses can sustain strong sectionals across 600–800m, and which rely on a sharp but shorter sprint.
- One-paced types: Recognise horses that are more one-paced and struggle to rate their best in races that require a fast sprint home but thrive when races are run at a stronger early speed, where the ability to sustain even speed in the run home is more valuable than acceleration.
- Late strength: Spot runs where a horse produced strong closing speed over the final 200m, especially relative to its earlier sectionals. This can reveal that it has finished the race with unused energy still in reserve, often a key sign of improvement next start.
- False flashing lights: Horses that appear to storm home late often attract attention as “flashing light runs.” But sectional times reveal whether they were truly finishing fast, or just passing rivals who were slowing dramatically. Putting the visual impression of a run into context helps you avoid attaching false merit to these runs and instantly improves the accuracy of your form analysis and betting decisions.
- New peaks: Detect performances in overall time or sectional splits, especially relative to the energy a horse expended early, that indicate it has reached a new level. Even if it didn’t win or finish close-up, these signs often point to untapped improvement just waiting for the right race scenario to turn into a result.
By reviewing sectional data this way, you move beyond surface-level conclusions and start to uncover the true performance characteristics of individual horses. Not every horse shows consistent patterns, and it’s important not to overstate conclusions from limited evidence. But by letting the data gradually build a picture run by run, you can identify hidden merit, recognise noteworthy signs, and spot the keys that help predict future performance - turning deeper insights into smarter betting decisions.
⚠️ A Word of Warning: Overall Times vs WFA Performance Ratings
Don’t upgrade or downgrade a horse’s WFA Performance Rating just because the overall time was particularly fast or slow. Assuming that faster times always indicate stronger performance, or that slower times imply less merit, is one of the most common mistakes made by analysts using time data.
There are thousands of examples each year that prove this wrong. Even during Winx’s career, she sometimes ran slower overall times on the same day than horses many lengths inferior.
The strength of a race is shaped not only by overall time, but also by the balance of early pace and closing speed. WFA Performance Ratings measure that balance to determine the true speed merit of a race, making them far more reliable and effective than time ratings alone.
🎥 See our video: WFA Performance Ratings vs Overall Times – Why the Difference? for a deeper dive into this topic.
🔎 Going Deeper - Putting a Horse’s Runs into Race Context
Interpreting sectional times in isolation can result in false impressions. It’s essential to place a horse’s sectionals within the context of the race and the performances of other runners.
For example, a horse in their form data may appear to have run impressive sectionals over the final 600m and especially the last 200m, but when you compare it to the rest of the field, you might find that most horses recorded similarly fast closing splits due to the way the race was run. In that scenario, the performance is far less remarkable than it first appears.
Conversely, sectional figures that seem modest at face value can reveal genuine merit when assessed against the context of the race. A horse running comparable or stronger sectionals than others in a race that was not run to suit, for instance, may have produced an effort worth noting.
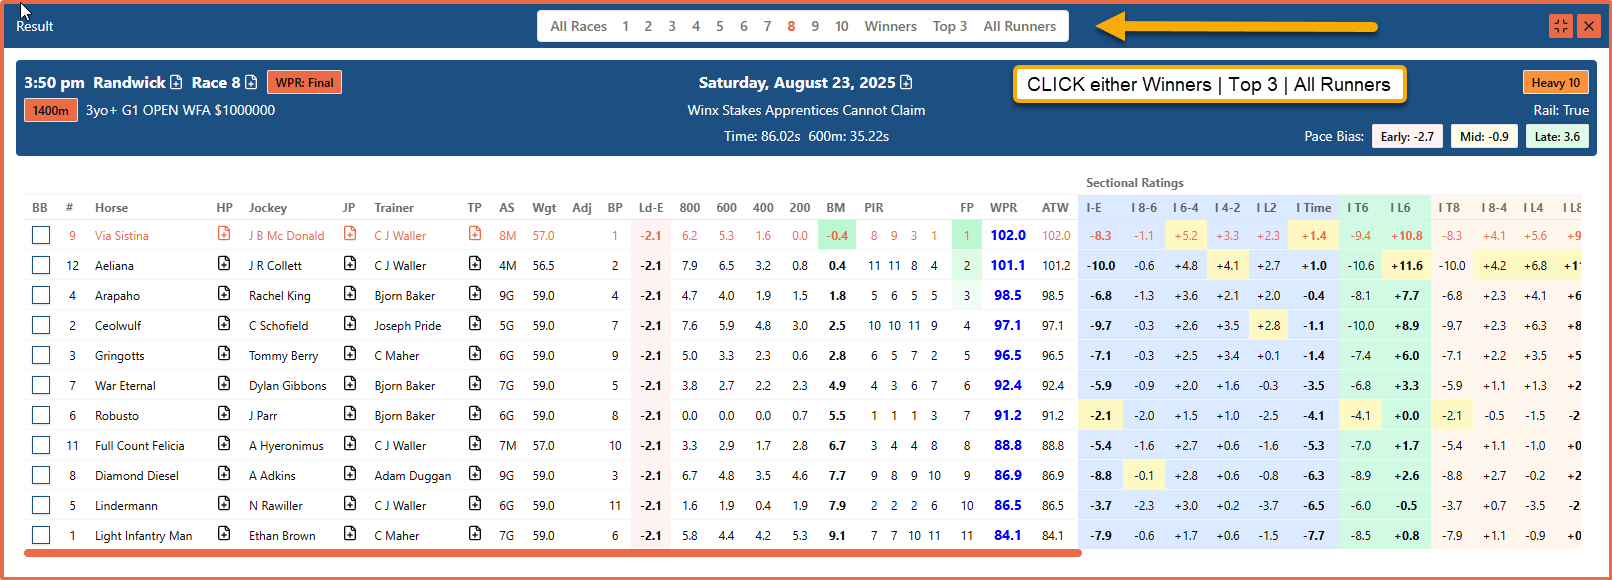
To see a horse’s sectionals in the context of the race it contested, simply click on an individual run in its form history. This will open a detailed race view that displays all runners in finishing position order, along with their sectional ratings and additional performance data.
For example, clicking Via Sistina’s last run (the Winx Stakes) brings up a pop-up with every runner’s sectional ratings, plus additional performance data such as positions relative to the leader at each stage of the race and their WFA Performance Ratings.
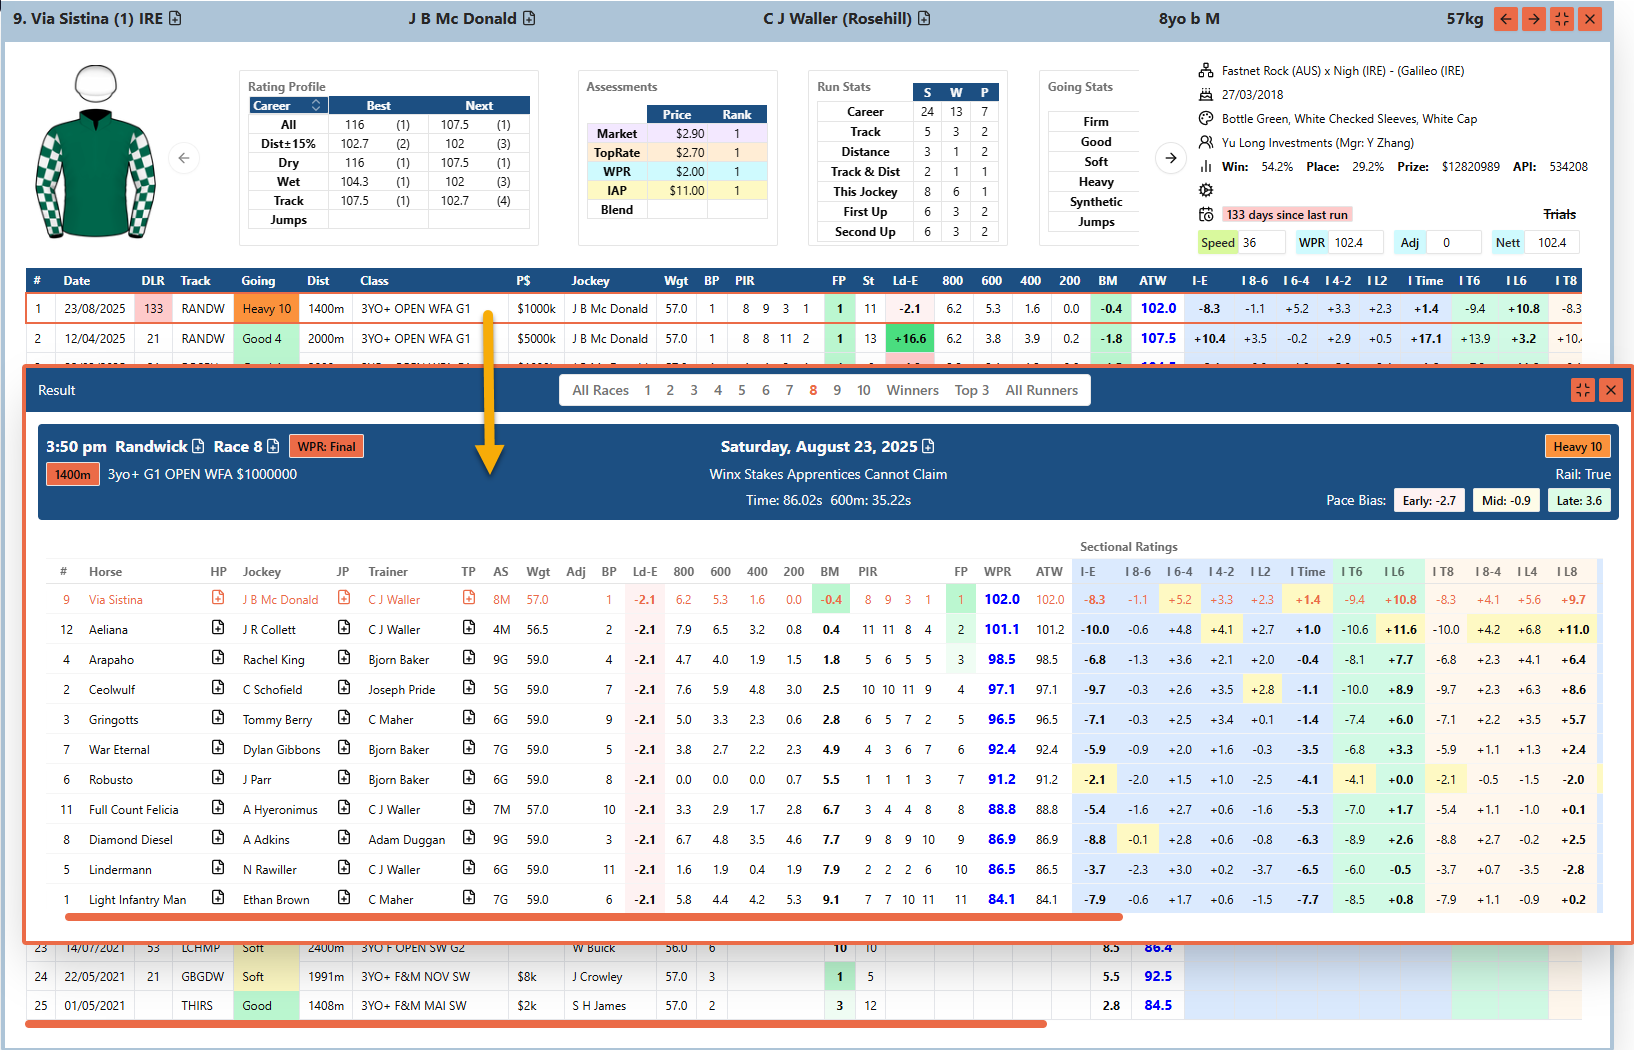
The values highlighted in yellow show the fastest rating for that section of the race.
Clicking the image above to show the race view, you can see Via Sistina won with a time rating of +1.4 lengths. That figure isn’t especially fast, but the overall time was impacted by her position in running and pace. She was 6.2 lengths off the lead at the 800m, with an early speed rating of –8.3 lengths below standard. This implies that the leaders were travelling at about –2.1 lengths below standard early, as shown in the Ld-E (Leader – Early Speed) column.
The quality of her performance came through later: an explosive +5.2 lengths acceleration between the 600m and 400m, and an overall +10.8 lengths final 600m.
- Aeliana recorded the fastest last 800m (+11.0 lengths) and 600m in the race (+11.6 lengths).
- Ceolwulf closed with the sharpest final 200m (+2.8 lengths), just shading Aeliana over the last part of the race.
⚠️ A Word of Warning: Don’t Anchor to Fast Closing Sectionals
One of the most common mistakes punters make is assuming that the fastest closing sectionals in a race, or one horse running home quicker than another, automatically mean there was extra merit in the performance beyond the bare result and rating.
Horses that conserve energy early are entitled to run home faster than others, especially if they are of similar or greater overall ability as measured by their WFA Performance Ratings. This is why it’s a trap to get in the habit of upgrading backmarkers just because they clock quicker closing splits. They often appear strong late simply because they did less work in the early stages.
A horse’s performance is always about more than just its final 600m or 200m sectional. The great mare Sunline, a renowned leader, won 13 Group 1 races, including two Cox Plates and two Doncaster Handicaps. In virtually all of those races, many of her rivals produced faster closing sectionals, making ground late; yet Sunline remained the dominant G1 force where it mattered, the winning post.
The key is to use sectional ratings to identify when a horse has produced something genuinely noteworthy in the context of the race, and/or its own past performances and ratings. In other words, sectionals should add context to your assessment, not dictate it. The WFA Performance Ratings remain the most reliable guide to overall performance merit.
⬅️ Review back to the meeting level
While studying the form and reviewing the race details of a horse’s past run, you can also zoom out to view its sectional data in the context of the entire meeting. This wider perspective can reveal insights you might not see when focusing on a single race in isolation.
At the top of the race detail screen, you’ll find a meeting-level menu. This lets you step back and review sectional and performance data across the card, whether you want to see just the winners, the top three in each race, or every runner from the meeting. (As shown in the image below — click to expand.)
Meeting Level Sectional Ratings Screen
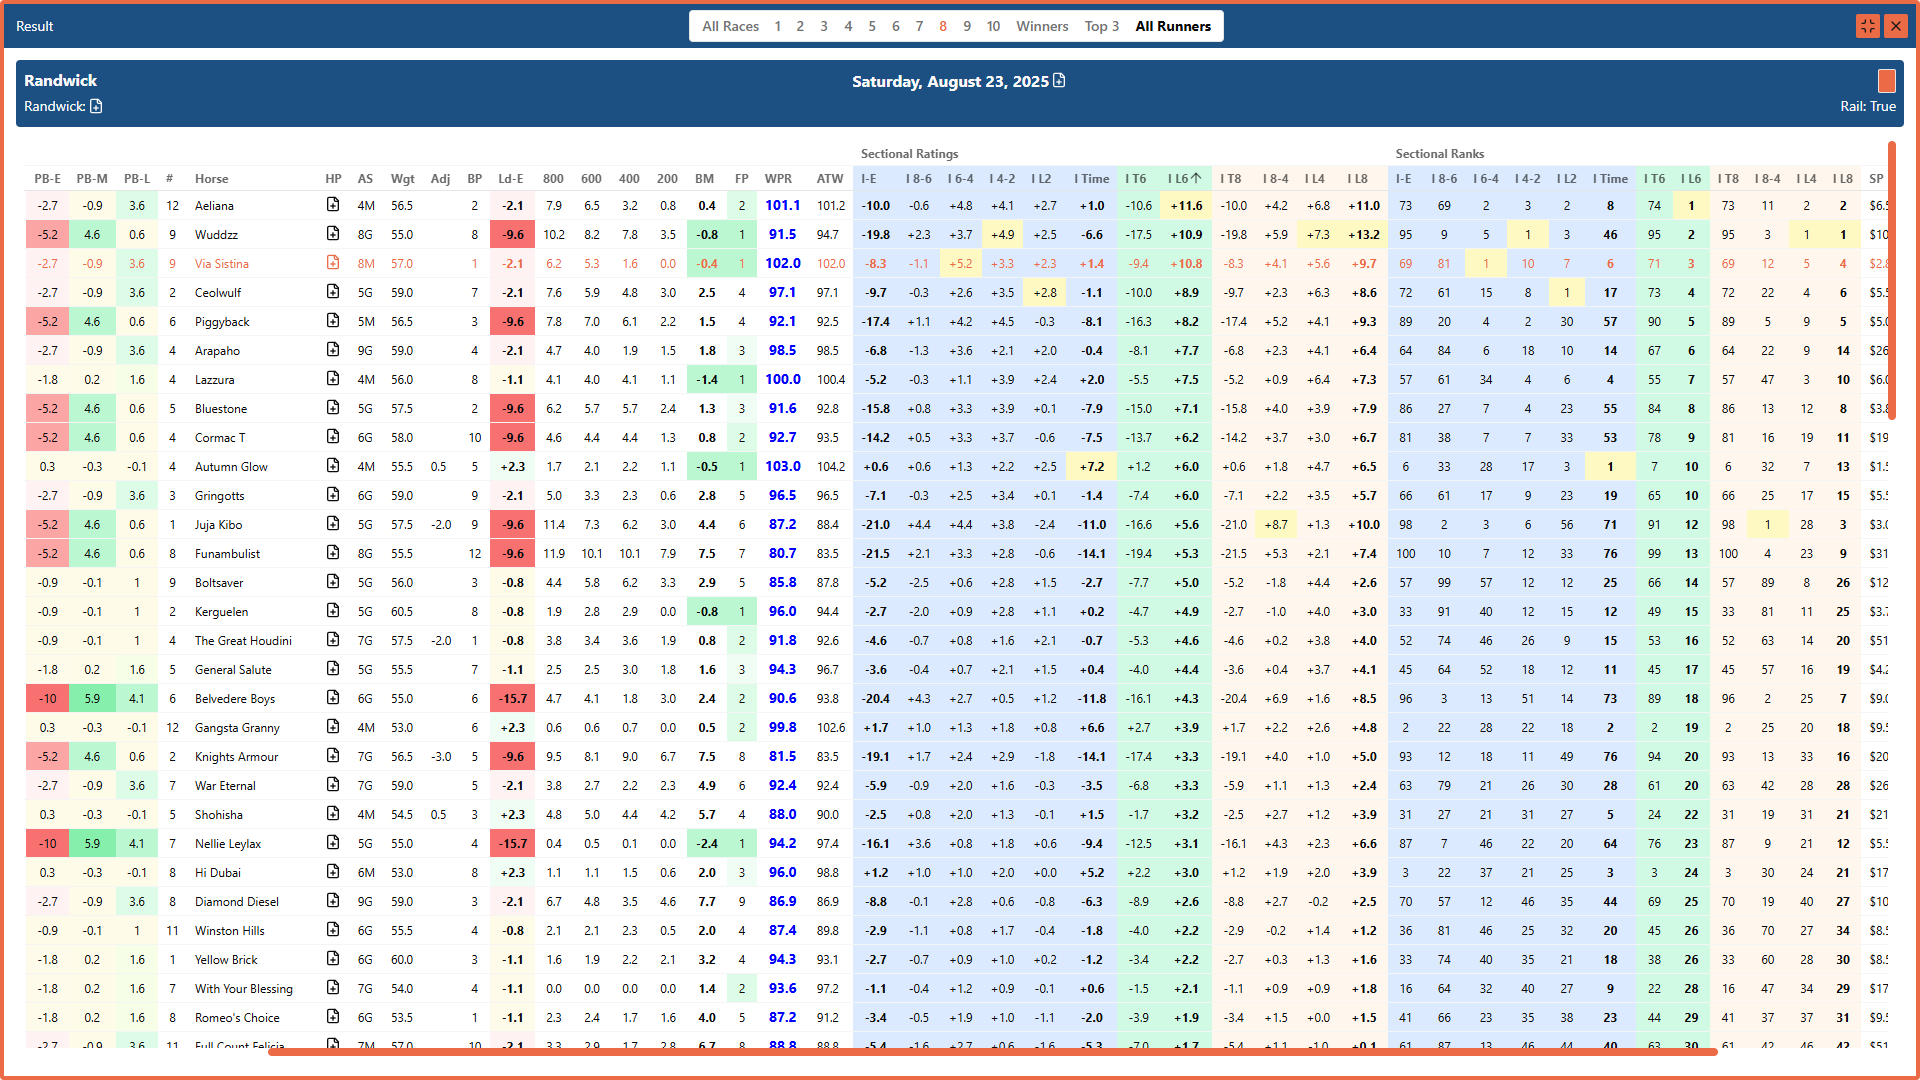
You can see by expanding the image above that all runners at the meeting are sorted by their last 600m ratings (by clicking on that column heading). In this example, Aeliana was the fastest (+11.6 lengths), followed by Wuddzz (+10.9 lengths) and Via Sistina (+10.8 lengths).
On the right-hand side of the screen, you’ll also see meeting-level ranks for each horse’s sectional ratings compared to the rest of the runners on the day. If you switch the view to Winners or Top 3, those ranks automatically update to reflect only the runners shown on screen.
The yellow highlights indicate the fastest rating at the meeting for each sectional.
Post-Meeting Analysis
TopRate offers a powerful toolkit for post-meeting analysis, with sectional time ratings providing an extra layer of depth to the review process. Once a meeting is complete and ratings data has been updated in TopRate, you can revisit the results to examine sectional time ratings alongside other key performance measures.
When are Sectional Time Ratings updated?
Sectional Time Ratings are finalised after each meeting as part of our review process, alongside WFA Performance Ratings. If you see blank sectional ratings in TopRate when reviewing results, it simply means we are still waiting on verified times and sectionals. This process usually takes 2–5 days, with metropolitan meetings given priority.
By default, when you click into a past meeting in TopRate, you’ll land on the meeting results page. Here, each race is listed down the page, giving you a clear overview of the results and allowing you to see the sectional ratings attached to every performance.
Meeting Results Example: Randwick 23/8/2025 (Race 7-8)
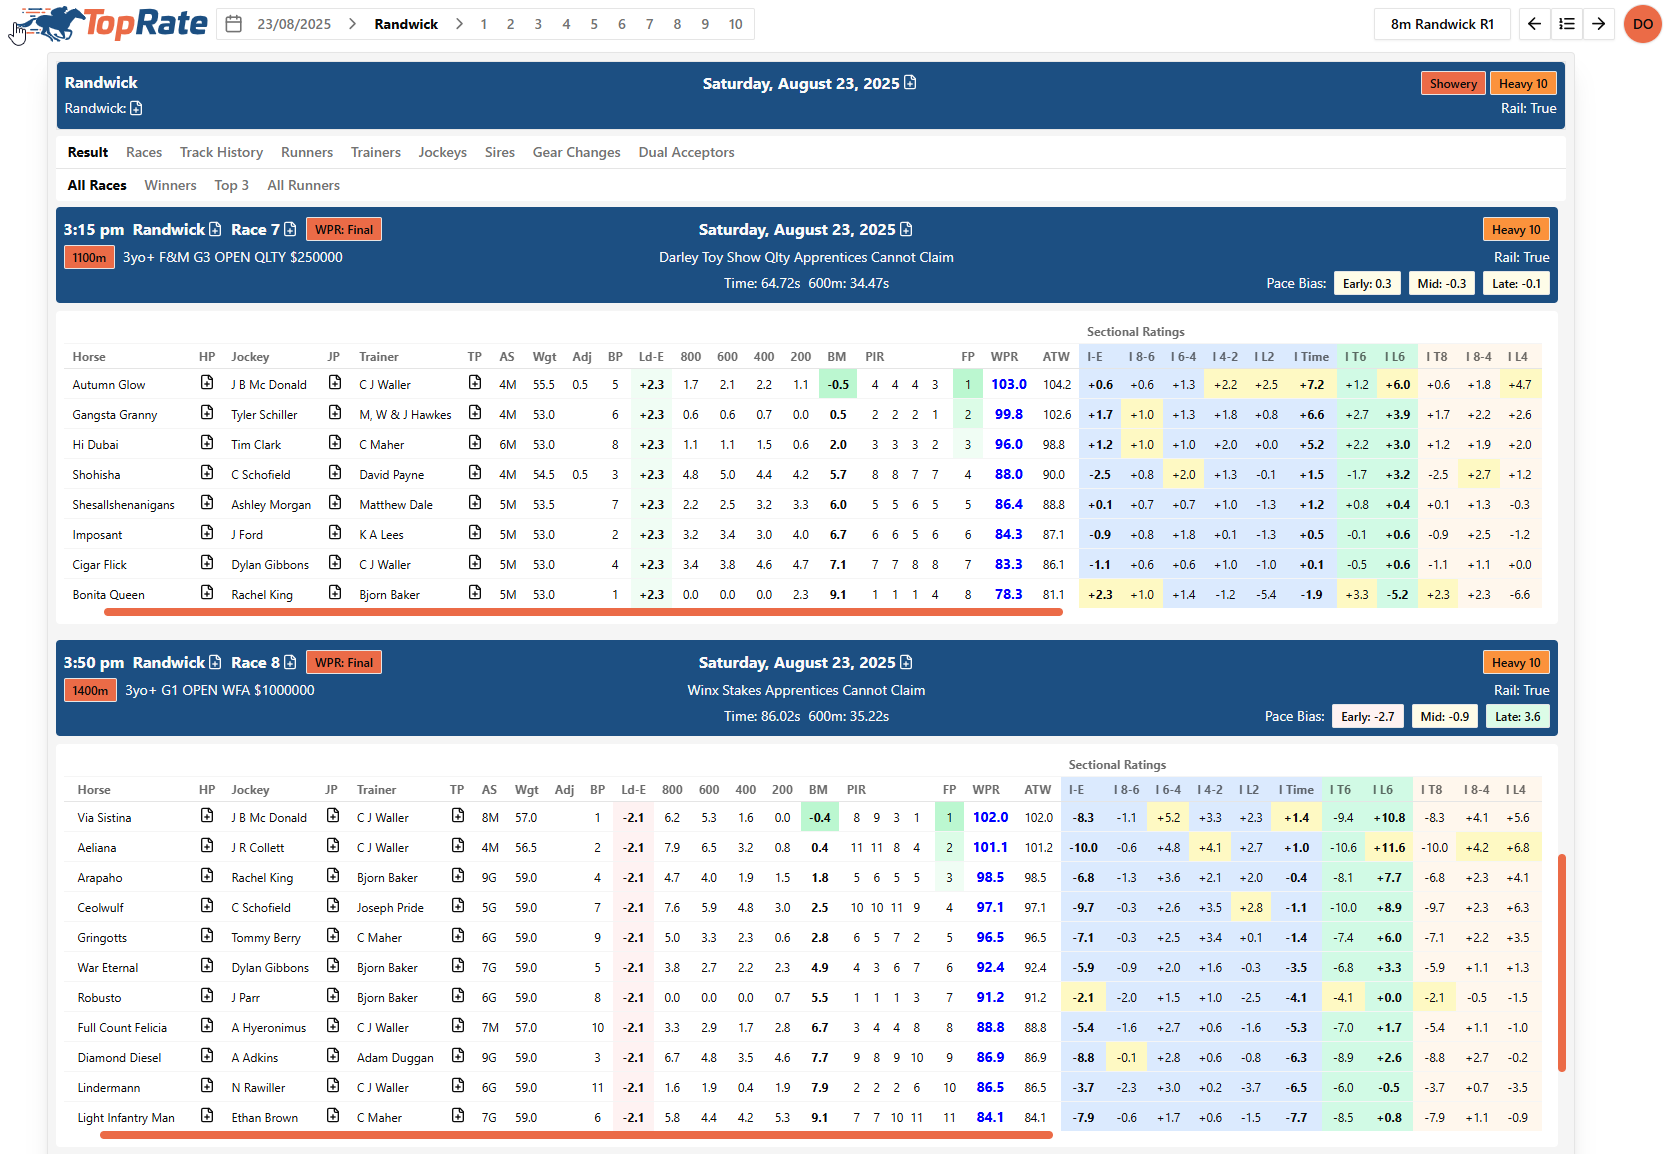
Scrolling to the right will display the sectional ranks for each horse's ratings within its race.
As highlighted in the Pre-Race Form Analysis section, the top section of the results window includes a meeting-level menu. This allows you to review sectional rating data across the entire meeting, with the option to filter for just the winners, the top three in each race, or every runner on the card.
Returning to the All Runners view from the example meeting above, the display shows every horse’s sectional ratings for the meeting, sorted by their last 600m. The list runs from the fastest at the top, down to the 29th quickest, before you need to scroll further to see the rest.
By clicking on any of the sectional column headings, you can instantly sort all runners in the meeting by that value. It’s a quick and effective way to highlight the horses you’re most interested in reviewing.
As noted above, the fastest last 600m came from Aeliana (+11.6 lengths), followed by Wuddzz (+10.9 lengths) and Via Sistina (+10.8 lengths). It’s important to add context, though: Wuddzz travelled more than seven lengths slower to the 600m mark than the other two, resulting in just the 46th best overall time rating (I Time) of the meeting and a significantly lower WFA Performance Rating. This puts his closing sectionals into clearer perspective.
Looking further down the page, you’ll see Autumn Glow’s +7.2 I Time highlighted as the fastest overall time rating of the meeting. This is also confirmed in the rankings to the right, where she holds the #1 position. Notably, Autumn Glow also ran the 3rd fastest last 200m of the meeting, showing she was still finishing fast despite displaying a high level of speed to that point.
When a horse produces a fast overall time rating and is still among the quickest late finishers on the day, it’s a strong sign of a high-quality performance.
📝 Using Run Notes: Any conclusions from your post-meeting reviews, or insights gained from analysing a horse’s form, can be saved as run notes in TopRate (RN column). These notes stay attached to that performance and will automatically appear in the horse’s form history every time it races again.
💡 A Final Note - Using Lengths as the Unit of Measurement
Sectional Time Ratings are expressed in lengths because lengths are intuitive and directly relatable when comparing horse performances. However, it’s worth understanding the nuance of using lengths as an absolute measure.
A figure of +6 lengths can mean very different things depending on race distance:
- Over 1200m, +6 equates to about +1 length per 200m split (6 sections in total).
- Over 2000m, the same +6 only equals +0.6 lengths per 200m split.
If a 2000m race were run at +1 length per 200m, the equivalent rating would be +10 lengths faster than standard, not +6.
This highlights two important points:
- Longer races allow for greater variation in overall time ratings (positive or negative) simply because of distance, as well as the influence of early pace when the run to the 800m or 600m is much longer than in sprints.
- Final sectionals must be taken in context. The last 800m, 600m, 400m, and 200m are the same distance in every race, but in staying events, horses can conserve more cumulative energy due to the longer distance in the first section to the 800m mark. This gives them greater capacity to produce standout late sectionals compared to sprints, especially when you remember that sectional ratings are measured against the standard for that distance, which is naturally slower in longer races.
Technically, the most precise way to express sectional performance is in percentage terms (e.g., 10 points = 1%), which normalises performance across all distances. However, this would make it harder to connect the figures to what we see on the track, which is measured in lengths. Using lengths keeps the ratings practical and relatable, which is why TopRate adopts this approach.