Pace Bias - Explanation & Examples
Pace Bias data is found in numerous sections of the TopRate platform.
Horse Form - as part of the data for each horse run.

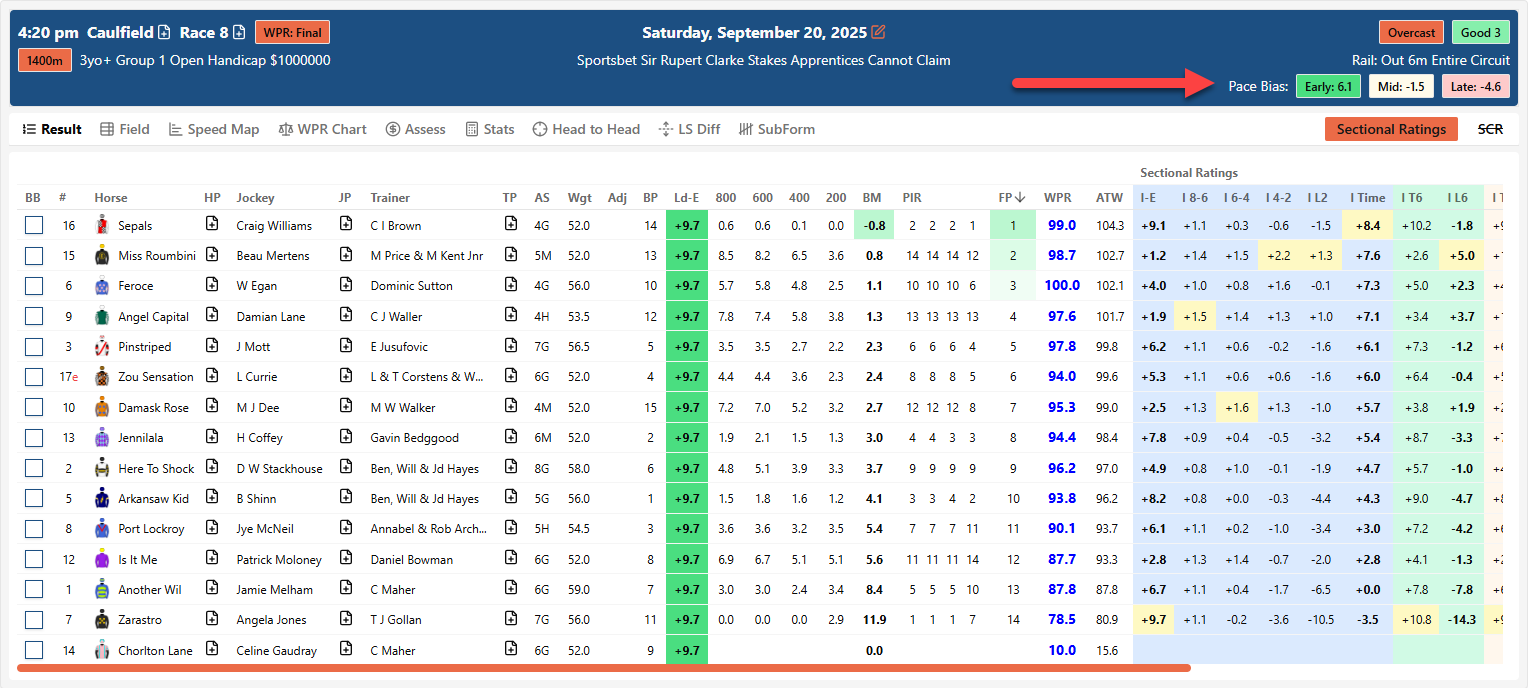
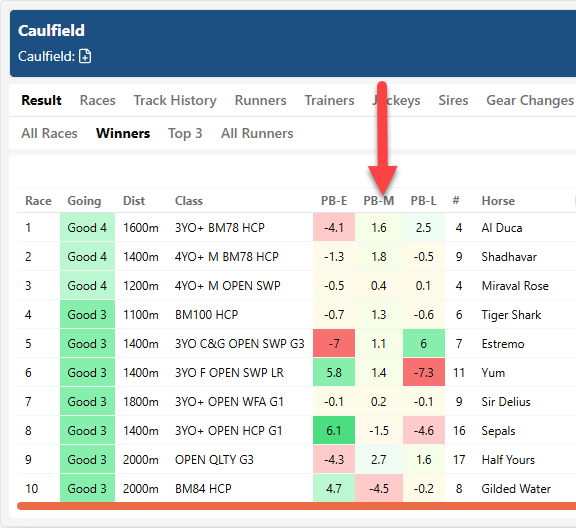
Race Headers - In the detailed results panel for an individual race.
Results Summaries - In the winners and placegetters results summary for past meetings.
What is Pace Bias?
Pace Bias measures how the speed in a race was distributed, expressed in lengths, compared to what is typical for a race run in that overall time.
It is measured using the speed of the race based on the first horse to reach each sectional point:
- Early: from the start to the 800m mark (leader)
- Middle: from 800m to 400m (leader)
- Late: the 400m to finish (winner)
The total quality of the speed is already captured in Sectional Ratings within TopRate. Pace Bias takes that “100% of speed” and shows how it was spread across the race compared to typical ratios, making it easier to see where the energy was used and how that affected horses in different positions.
For example, in a lower-quality race that finishes nine lengths slower than standard, the distribution might typically be -2 lengths early, -3 lengths mid-race, and -4 lengths late. The Pace Bias figure then shows how that individual race produced their minus nine length overall time compared to the usual pattern. That helps us understand the challenges faced by horses, depending on whether they raced on pace, in the midfield, or at the back of the field.
The same applies at the top level. If a Group 1 race is run six lengths faster than standard, historical data tells us what a “typical” distribution of that speed looks like. For instance, +3 lengths to the 800m, +1.5 lengths from 800m to 400m, and +1.5 lengths home. In that case, every section is well above average against the TopRate standard.
But let’s say the race we are analysing instead went +3 lengths to the 800m, -1 length from the 800m to 400m, and then +4 lengths home. At first glance, the +3 lengths early looks fast, but in fact, it is exactly typical for a race of this overall quality, so the early Pace Bias is zero. The middle section of -1 length looks only slightly below standard, but if +1.5 is typical for this level, the true bias is -2.5 lengths. The last 400m of +4 reads fast, and it is, but compared to the typical +1.5 it shows a +2.5 length late bias.
Pace Bias adds context. It explains not just whether a race was fast or slow, but how that speed was distributed against the norm, and in turn, the varying degrees of difficulty that horses faced depending on where they settled in the run.
Note: Where race data to the 800m was not recorded, TopRate will show an Early (to the 600m mark) and Late (final 600m) figure.
REPEAT: Pace Bias is NOT a measure of a race's overall time and sectionals against a fixed standard or benchmark. That information is contained in the Sectional Ratings
Pace Bias Implications
The way a race is run, expressed through the Pace Bias, helps add context to the rating that individual horses achieved. Some may have been well suited by the pace and others disadvantaged.
The suitability of the pace for a particular horse is a balance between how much energy they use in the early stages, where they are positioned in the field and how fast they need to run home in the middle and especially late stage (final 400m) to win.
While horses can exhibit individual characteristics that aren't consistent with the norm, the nature of racing and the evidence from historical data shows that, on average:
The slower the early pace bias, the more it favours horses closer to the lead and disadvantages those further back in the field. The faster the early pace bias, the more favourable the scenario for horses well back off the lead to make up ground and win.
If the runners close to the lead run slower than typical through the early stages for a race of that level, they have energy in reserve to sprint home fast. Those further back in the field face a more difficult task as they need to sprint home even faster to make up the necessary ground to win. There are limits to how fast horses can sprint home over the final 400m to 600m in a race, regardless of how much energy they conserve early.
On the other hand, if the leaders run along at a faster speed early compared to what's typical of that overall time and are going much slower late, those well back off the lead only need to maintain something like average speed over the final stages to make up the ground to win. They have a scenario that has allowed them to use their energy more efficiently.
Scenario examples
Early Pace Bias is -6 lengths SLOWER than typical.

In this scenario, Horse B faces the very difficult task of running home 12 lengths faster than what is typical to win. Far fewer horses can run +12 lengths fast than can run +6 lengths fast. The race shape makes it very difficult for those further back in the field to maximise their performance rating. Those closer to the lead in this type of scenario have a key tactical advantage.
Early Pace Bias is +6 lengths FASTER than typical.

In this scenario, Horse B has a much more favourable pace bias to optimise its performance rating. With a faster pace up front, Horse B has clocked an individual early section that is on par with the typical early speed for leaders, and if they maintain that speed, they can make up the required ground to win. It is much easier for a horse back off the lead to run along at an even speed through all sections of the race than it is to run 12 lengths slower early and then have to sprint home 12 lengths faster late.
Horse A has run +6 lengths faster than typical early in this scenario. For every horse, there is a threshold of early energy usage that, once crossed, will limit their potential to run up to their better ratings. There are exceptions, but for most horses racing near the lead, it isn't optimal for their own performance to go excessively fast in the early stages, and as you can see above, when they do, it also makes the task for those back off the speed easier to optimise their performance.
The statistics below will help to put these concepts into further context.
Race Shape Statistics
Historical data clearly shows how varying levels of early or late pace bias (race shape) suit different horses, depending on their position in the field.
The suitability of early pace for leaders and on-pace runners
The table below shows the results for genuine market chances up to $10 SP that were leading or within one length of the lead at the 800m mark, based on the early pace bias (race shape).
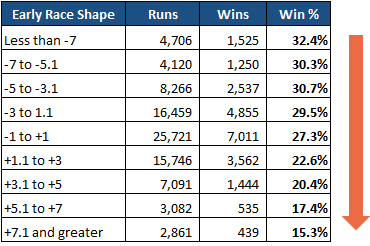
When the early pace bias is moderate to slow (e.g., more than 3 lengths slower than typical), leaders and on-pace horses up to $10 in the market have a 30% plus winning strike rate. When the early race shape is faster (e.g. more than 3 lengths faster than typical), the strike rate falls to around 20% and lower. That's a significant difference.
The suitability of race shape for those further back in running
The table below shows the results for genuine market chances up to $10 SP that were between four and seven lengths back from the lead at the 800m mark, based on the early pace bias (race shape.)

The first thing you may notice is that horses further back in the field have a much lower winning strike rate than those racing closer to the lead. This in itself is an important principle in racing analysis and betting. Putting that aside, you will see that the slower the early pace, the less often those further back in the field win. They have a more favourable pace scenario when the early pace is faster, and their strike rate improves.
Using Pace Bias in Form Analysis
Consideration of pace bias in conjunction with WFA Performance Ratings can offer valuable insights to help put a horse's past performances into context and predict their potential performance in an upcoming race.
Horses that were poorly suited in recent runs and are likely to face a more favourable pace and position scenario in this race are prime candidates to improve. Conversely, horses that were ideally suited by the pace in recent runs and had every chance to run up to their best ratings should be viewed in that light. They will often regress next time out when faced with a more neutral or less favourable race shape.
Some horses are versatile and can perform equally well in a variety of pace scenarios. As always, treat each horse as an individual.